

We strive to provide an inclusive and supportive work environment for our colleagues, with equal opportunities for professional growth throughout their career. To achieve this commitment, we need to fully understand our colleague diversity. By doing so, we’re able to tailor our employee experience and make sure we all have the same opportunities for development, progression and reward. We’re also able to identify where we can do better.
Here you’ll find how we ended 2023 with our shoreside diversity, equity and inclusion (DEI) figures, with a look at ethnicity, sexual orientation, disability and gender. These figures will be updated again in 2024 and shared later in the year.
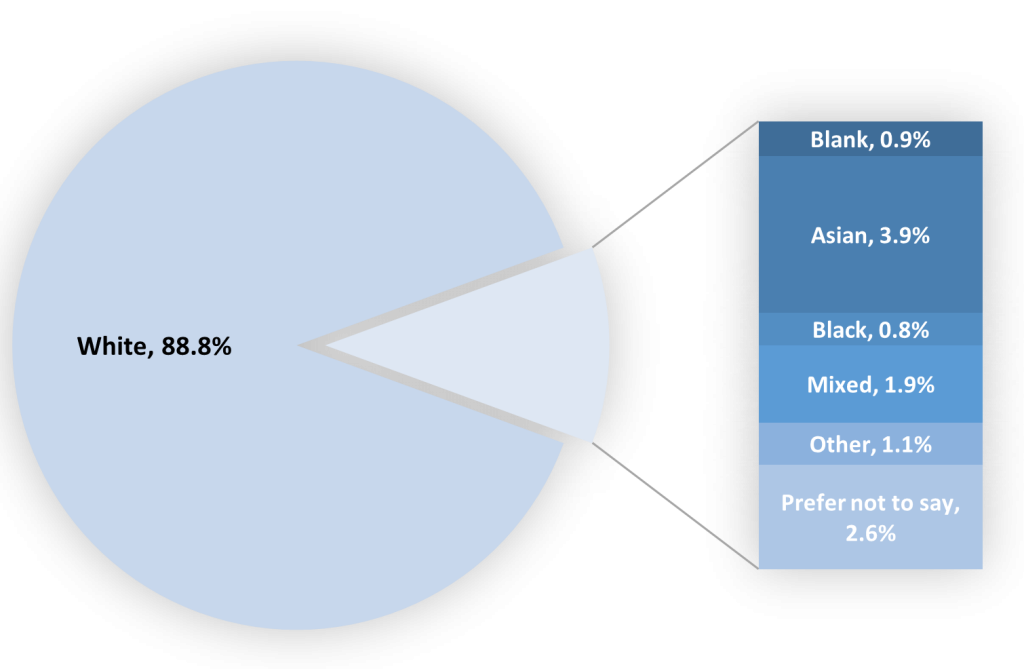
Ethnicity
| (%) | Count | |
| Blank | 0.9% | 14 |
| Asian | 3.9% | 63 |
| Black | 0.8% | 13 |
| Mixed | 1.9% | 31 |
| Other | 1.1% | 17 |
| Prefer not to say | 2.6% | 42 |
| White | 88.8% | 1431 |
Year on year
Since November 2021, we’ve seen growth in the representation of our Asian, Black and Mixed populations.
| Nov-21 | Nov-22 | Nov-23 | ||||
| (%) | Count | (%) | Count | (%) | Count | |
| Blank | 0.2% | 3 | 0.3% | 5 | 0.9% | 14 |
| Asian | 2.8% | 35 | 3.2% | 49 | 3.9% | 63 |
| Black | 0.4% | 5 | 0.8% | 12 | 0.8% | 13 |
| Mixed | 1.3% | 16 | 1.9% | 30 | 1.9% | 31 |
| Other | 1.3% | 16 | 1.0% | 15 | 1.1% | 17 |
| Prefer not to say | 3.3% | 41 | 2.7% | 42 | 2.6% | 42 |
| White | 90.6% | 1,120 | 90.2% | 1,402 | 88.8% | 1,431 |
- Asian ethnicity has grown from a headcount of 35 (representing 2.8% of our population) to a headcount of 63 (representing 3.9% of the CUK population).
- Black ethnicity has grown from a headcount of 5 (representing 0.4% of our population) to a headcount of 13 (representing 0.8% of the CUK population).
- Mixed ethnicity has also grown from a headcount of 16 (representing 1.3% of our population) to a headcount of 31 (representing 1.9% of the CUK population).
Differences across grades
When looking across our grade groups, there’s no significant trends in terms of imbalance between Carnival UK overall and specific grades other than:
- Asian, Black, and Mixed ethnicities have no stated representation at grade CUK04 or above.
- Grades CUK09-11 have the most diversity with Asian, Black and Mixed ethnicities all being represented above the CUK average.
| Nov-23 | ||||||
| G00-04 | G05-08 | G09-11 | G12-15 | Total | ||
| Ethnicity | Blank | 0.0% | 0.5% | 1.8% | 0.6% | 0.9% |
| Asian | 0.0% | 3.6% | 4.5% | 4.1% | 3.9% | |
| Black | 0.0% | 0.5% | 0.9% | 1.2% | 0.8% | |
| Mixed | 0.0% | 2.2% | 2.0% | 1.7% | 1.9% | |
| Other | 0.0% | 1.2% | 1.8% | 0.2% | 1.1% | |
| Prefer not to say | 11.9% | 2.5% | 2.2% | 2.3% | 2.6% | |
| White | 88.1% | 89.5% | 86.8% | 89.8% | 88.8% | |
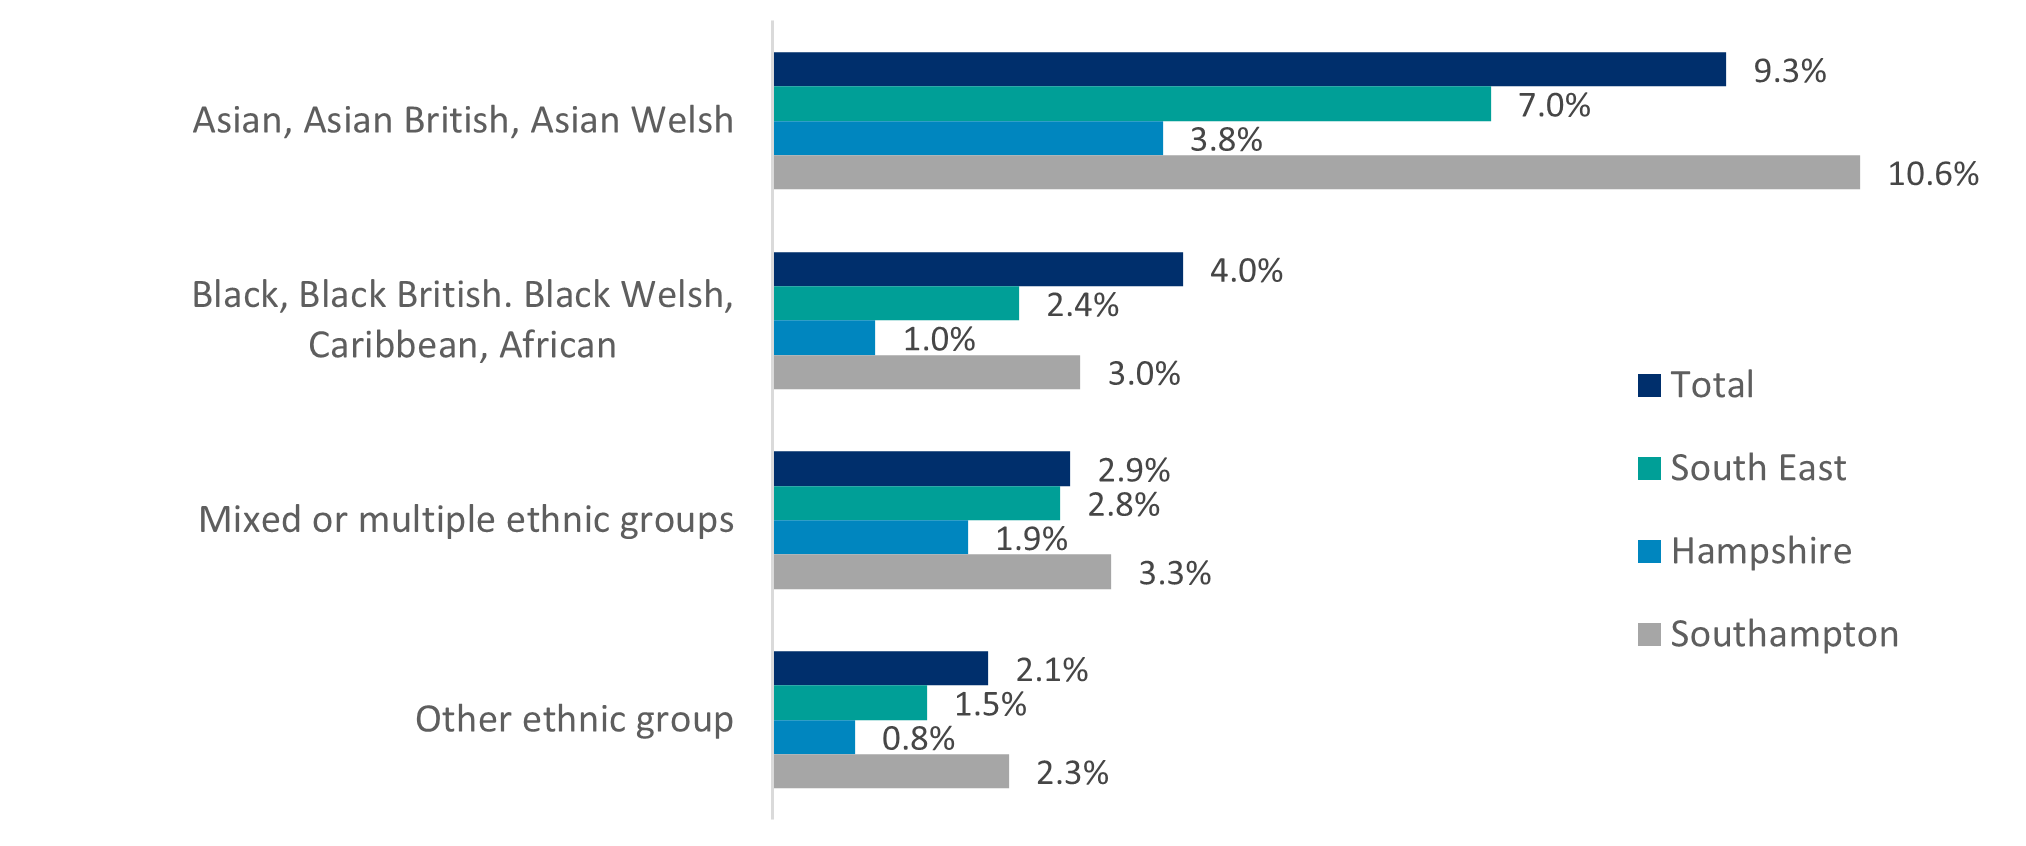
Compared against external data
The latest census data taken in 2021 shows that the South East – and in particular Hampshire – has a less represented population of Asian, Black, and Mixed ethnicities when compared to the UK as a whole. However, Southampton is much more in line with the UK average. This insight helps us compare Carnival UK’s ethnic representation against our surrounding talent pool:
- Asian ethnicity at Carnival UK (3.9%) is similar to Hampshire’s figure of 3.8% but is significantly lower than the UK figure of 9.3% and Southampton’s figure of 10.6%.
- Black ethnicity follows the same trend at 0.8% for Carnival UK (CUK). CUK representation is similar to Hampshire’s figure of 1% but is significantly lower than the UK figure of 4% and Southampton’s figure of 3%.
- Mixed ethnicity at CUK (1.9%) is closer to national and local representation but is still slightly underrepresented. While Hampshire also has a figure of 1.9%, the UK has a figure of 2.9% and Southampton has a figure of 3.3%.
In August 2022, we worked with an independent agency to complete a benchmarking exercise for us to compare selected demographic data against our local corporate market (1.5-hour commute time from Southampton):
- This data showed a talent supply in the local area of between 2% and 4% Asian ethnicity against CUK’s 3.9%.
- This data showed a talent supply in the local area of between 1% and 2% Black ethnicity against CUK’s 0.8%.
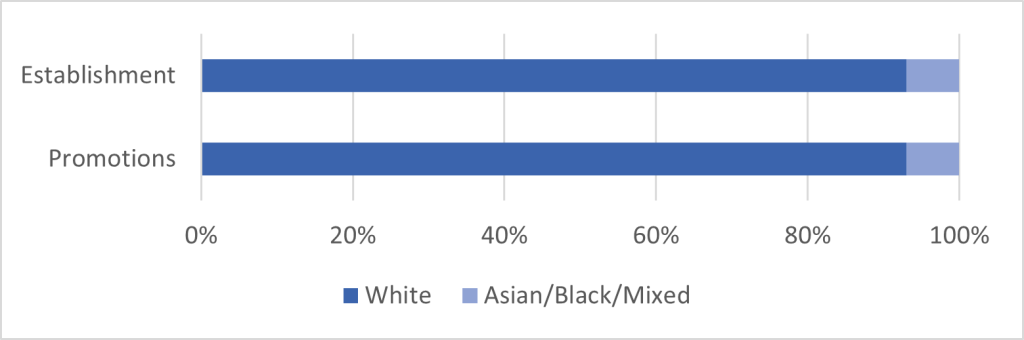
Promotions
We also recently looked at promotion data to help us understand any differences or potential bias in specific demographics receiving promotions at Carnival UK. Due to the low numbers of colleagues of Asian, Black and Mixed ethnicities at CUK (though representation is increasing), we opted to collate data for these ethnicities in comparison to White ethnicity to better understand promotion rates in our organisation. When looking at ethnicity, we found that we’re promoting colleagues from Asian, Black, Mixed and White ethnicities in line with our establishment rates – this means that colleagues of Asian, Black and Mixed ethnicities are being promoted at the same rate as colleagues of White ethnicity.
| Ethnicity | Promotions (%) | Establishment (%) |
| White | 93% | 93% |
| Asian/Black/Mixed | 7% | 7% |

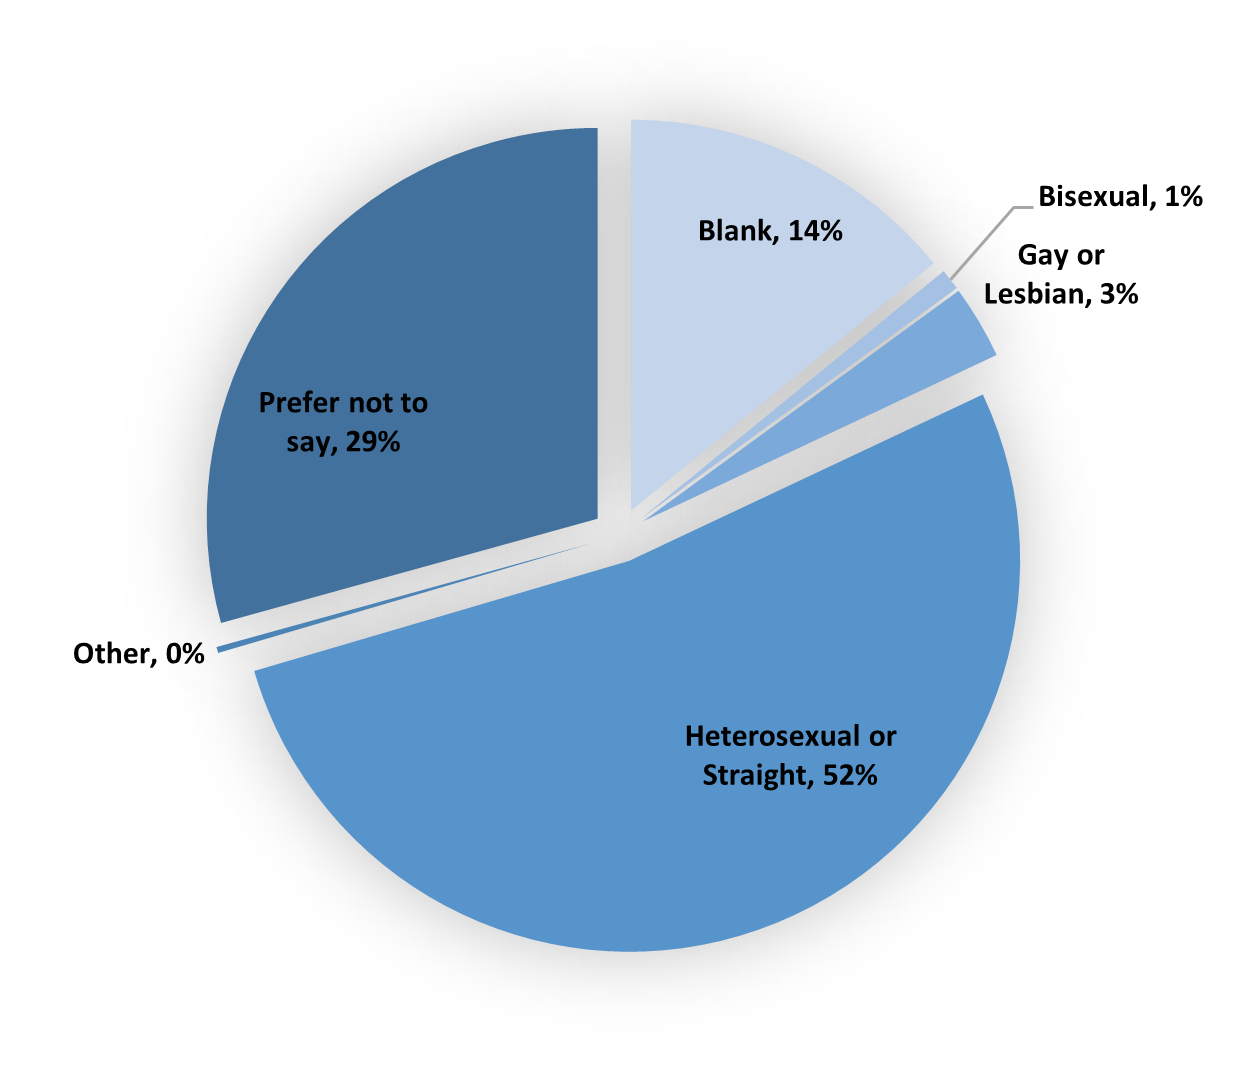
Sexual orientation
Carnival UK’s position (November 2023)
| (%) | Count | |
| Blank | 14.1% | 227 |
| Bisexual | 0.9% | 14 |
| Gay or Lesbian | 3.0% | 49 |
| Heterosexual or Straight | 52.5% | 845 |
| Other | 0.2% | 4 |
| Prefer not to say | 29.3% | 472 |
Year on year
Since November 2021, there have been no significant changes to the breakdown of sexual orientation of Carnival UK.
| Nov-21 | Nov-22 | Nov-23 | ||||
| (%) | Count | (%) | Count | (%) | Count | |
| Blank | 6.0% | 74 | 2.6% | 41 | 14.1% | 227 |
| Bisexual | 1.1% | 13 | 0.9% | 14 | 0.9% | 14 |
| Gay or Lesbian | 3.3% | 41 | 3.4% | 53 | 3.0% | 49 |
| Heterosexual or Straight | 57.8% | 714 | 56.7% | 881 | 52.5% | 845 |
| Other | 0.2% | 3 | 0.3% | 4 | 0.2% | 4 |
| Prefer not to say | 31.6% | 391 | 36.1% | 562 | 29.3% | 472 |
The largest anomaly with Carnival UK’s sexual orientation data is within our ‘prefer not to say’ population which represents 29.3% of our colleagues. This is against 7.06% in the South East’s and 8.3% in Southampton’s census data and so could indicate an environment in which our colleagues don’t feel comfortable in sharing this information.
Compared against census data
The latest census data taken in 2021 shows that, compared to both the South East and Southampton, Carnival UK’s LGBTQ+ populations are fairly represented. It’s worth reiterating that Carnival UK have a large proportion of colleagues who have answered ‘prefer not to say’ which could significantly impact some of these figures if their answers change.
- Our bisexual population is slightly underrepresented with only 0.9% compared to the South East’s average of 1.29% and Southampton’s average of 2.36%.
- Our gay or lesbian population is above the census average at 3% compared to the South East’s average of 1.48% and Southampton’s average of 1.99%.
- Our heterosexual or straight population is at 52.5% compared to the South East’s average of 89.84% and Southampton’s average of 86.76%, but we do have a large proportion of our colleagues answering ‘prefer not to say’ which may be skewing this information.
| Area name | Straight or heterosexual |
Gay or lesbian |
Bisexual
|
Pansexual | Asexual
|
Queer
|
All other sexual orientations
|
Not answered |
| South East | 89.84% | 1.48% | 1.29% | 0.22% | 0.06% | 0.03% | 0.02% | 7.06% |
| Southampton | 86.76% | 1.99% | 2.36% | 0.37% | 0.13% | 0.05% | 0.03% | 8.30% |
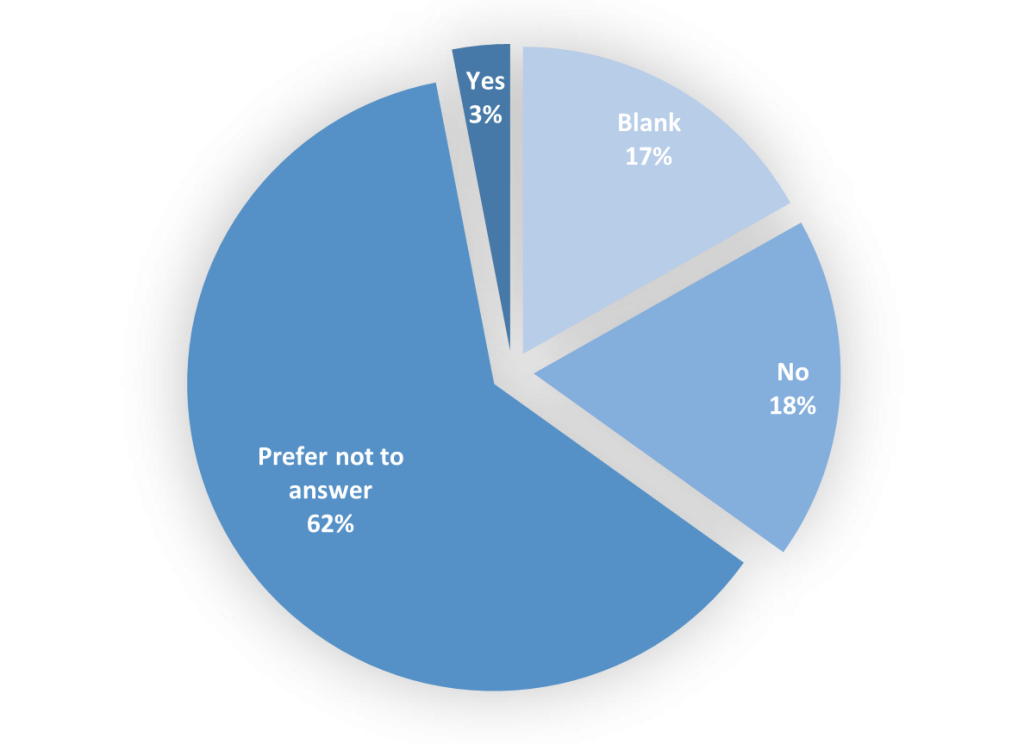
Disability
Carnival UK’s position (November 2023)
| (%) | Count | |
| Blank | 16.8% | 271 |
| No | 18.1% | 291 |
| Prefer not to answer | 62.1% | 1,000 |
| Yes | 3.0% | 49 |
Year on year
Since November 2021, there’s been no significant changes to the representation of disabilities within Carnival UK.
The largest anomaly is again in the ‘prefer not to say’ population as this accounts for 62% of total colleagues. This may indicate a culture in which people do not feel comfortable to share this kind of information and makes insights into disabilities difficult as we don’t have an accurate picture.
| Nov-21 | Nov-22 | Nov-23 | ||||
| (%) | Count | (%) | Count | (%) | Count | |
| Blank | 6.8% | 84 | 2.8% | 43 | 16.8% | 271 |
| No | 19.3% | 239 | 19.0% | 295 | 18.1% | 291 |
| Prefer not to answer | 70.5% | 871 | 74.8% | 1163 | 62.1% | 1,000 |
| Yes | 3.4% | 42 | 3.5% | 54 | 3.0% | 49 |
Differences across grades
When looked at across grades, CUK15-05 are fairly comparable to Carnival UK’s overall split. However, grades CUK00-04 have no disability representation and a higher than average ‘prefer not to answer’ (67% compared to the company average of 62%).
| Nov-23 | |||||
| G00-04 | G05-08 | G09-11 | G12-15 | Total | |
| Blank | 14.3% | 12.0% | 14.6% | 25.5% | 16.8% |
| No | 19.0% | 21.1% | 19.7% | 12.4% | 18.1% |
| Prefer not to answer | 66.7% | 64.1% | 63.0% | 58.1% | 62.1% |
| Yes | 0.0% | 2.8% | 2.7% | 3.9% | 3.0% |
Compared against census data
The latest census data taken in 2021 shows that, compared to local averages, those with disabilities are underrepresented at Carnival UK. Just 3% of our colleagues are reporting disabilities against 19.6% in the Southampton area. However, it’s worth noting that this is broken down into 8.2% identifying as having a disability that limits day-to-day activities a lot and 11.3% as limiting day-to-day activities a little.
Again, these figures are potentially being heavily influenced by the large number of our colleagues who have responded with ‘prefer not to answer’ (62%).
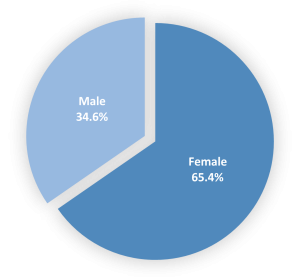
Gender
Carnival UK’s position (November 2023)
| (%) | Count | |
| Female | 65.4% | 1,053 |
| Male | 34.6% | 558 |
Year on year
Since November 2021, we have seen a slight increase (3.3 percentage points) from 62.1% to 65.4% in our female population.
| Nov-21 | Nov-22 | Nov-23 | ||||
| (%) | Count | (%) | Count | (%) | Count | |
| Female | 62.1% | 768 | 65.7% | 1,022 | 65.4% | 1,053 |
| Male | 37.9% | 468 | 34.3% | 533 | 34.6% | 558 |
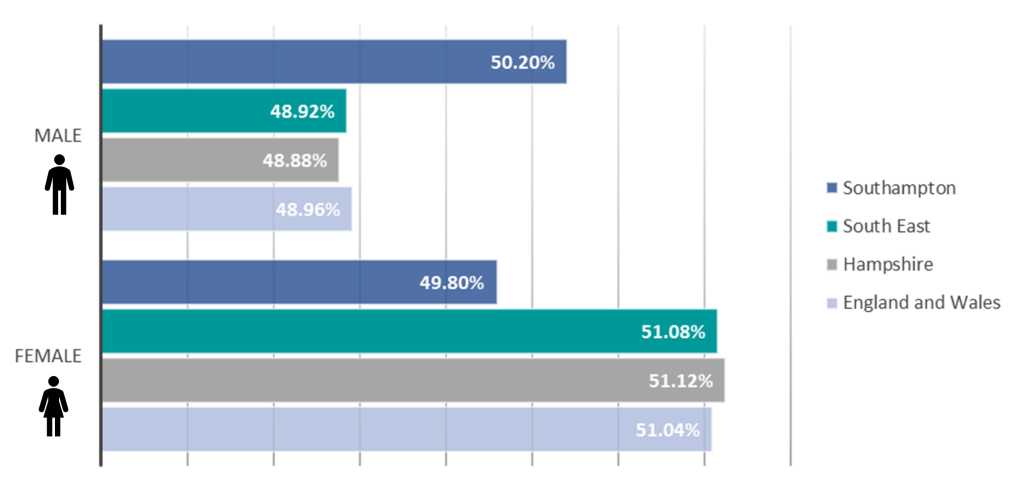
Compared against census data
The latest census data taken in 2021 shows that, at a regional and national level, gender is split 51% female to 49% male. This is slightly more skewed towards males in Southampton with the breakdown being almost 50:50.
This shows that, as a business, we are far more skewed towards females (65.4% of our population) against the census data of 50-51%.
Differences across grades
When looking across our CUK grade groups, this is when we see the greatest gender imbalance.
- Grades 12-15 have the highest level of imbalance, with a disproportionate number of females (82%) compared to the CUK average of 65.4%
- Grades 09-11 are also skewed to females (65.9%), but this is more representative of the CUK average of 65.4%
- Grades 05-08 show the most gender balance with colleagues being 45.7% male to 54.3% female
- Grades 00-04 are the only CUK levels that skew towards males, with colleagues in these grades being 61.9% male – almost double the CUK average of 34.6%.
| Nov-23 | |||||
| G00-04 | G05-08 | G09-11 | G12-15 | Total | |
| Female | 38.1% | 54.3% | 65.9% | 82.0% | 65.4% |
| Male | 61.9% | 45.7% | 34.1% | 18.0% | 34.6% |
Gender pay gap report
Gender representation at Carnival UK has been discussed in greater detail in our latest gender pay gap report. In this 2022 snapshot, we saw a slight decrease in the mean pay gap which reduced by 1 percentage point to 35% from the previous year. This report highlights the need for equal gender representation across all grades and for increased female representation in senior roles:
“To eradicate the gap, we need greater gender balance across the organisation, and will continue our focus on increasing the number of women in senior roles in general, addressing gender representation across the various teams and business areas.”
For information on what we’re doing to make Carnival UK a more diverse and inclusive workplace, please read our latest gender pay gap report. While the primary reason for this report is to assess gender balance, you’ll also find information about initiatives to support other characteristics and all colleagues in our organisation.
Our 2023 snapshot will be published in April 2024. In this report, we’ve committed to sharing further insights into how we’re championing diversity, equity and inclusion across Carnival UK.
Employee-led networks
If you’d like to get involved in supporting our effort to be a more diverse and inclusive organisation, you can get involved with our employee-led networks. These groups provide support, education and a place to feedback on how we could be doing better. We really benefit from everyone being involved in the networks – whether you identify with a characteristic a group supports or you’re keen to show allyship by promoting learning and supporting the conversation. Find out more here.
Personal data can make improvements for everyone
It can be hard to understand who makes up our organisation if people don’t tell us about the characteristics that form part of their identity. This data is treated confidentially and is used to ensure we’re offering a great colleague experience to everyone, regardless of their demographics.
For more information about how we use this information and how you can tell us more about yourself, click here.