

On this page you’ll find Carnival UK’s latest Diversity, Equity, and Inclusion (DE&I) figures, with a look at Ethnicity, Sexual Orientation, Disability and Gender.
It can be hard to understand who makes up our organisation if people don’t tell us about the characteristics that form part of their identity. This data is treated confidentially and is used to make sure that we’re offering a great colleague experience to everyone, regardless of their demographic. For more information about how we use this information and how you can tell us more about yourself, click here.
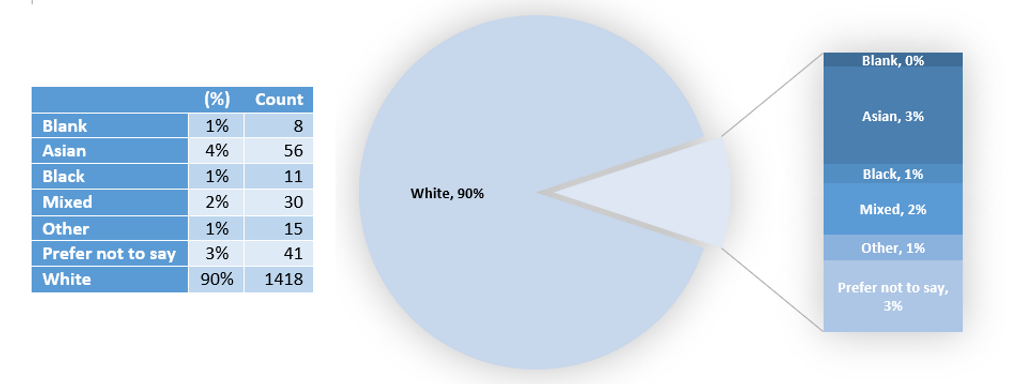
Ethnicity
Carnival UK current position: April 2023
Year on year
Since April 2021 we have seen some growth in the representation of our Asian, Black and Mixed populations.
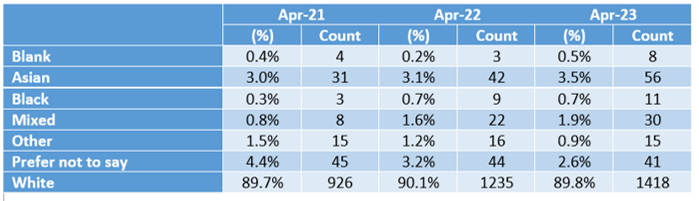
- Asian ethnicity has grown from a headcount of 31 representing 3% of our population in April 2021 to now a headcount of 56 representing 3.5% of the CUK population.
- Black ethnicity has grown from a headcount of 3 representing 0.3% of our population in April 2021 to now a headcount of 11 representing 0.7% of the CUK population.
- Mixed ethnicity has also grown from a headcount of 8 representing 0.8% of our population in April 2021 to now a headcount of 30 representing 1.9% of our population.
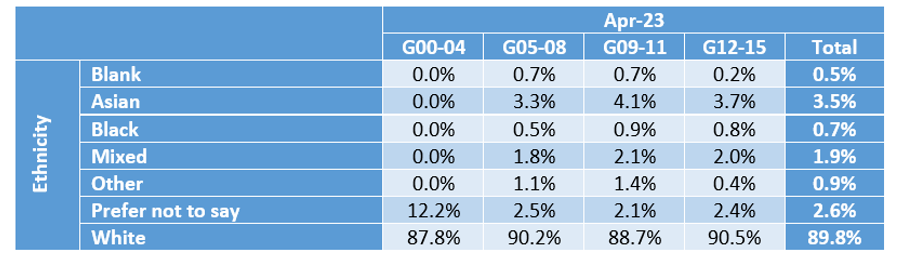
Differences across grades
When looked at across CUK’s grade groups, there are no significant trends in terms of imbalance between CUK overall and the specific grades between CUK15-CUK05. However Asian, Black, and Mixed ethnicities have no stated representation at grade 4 or above.
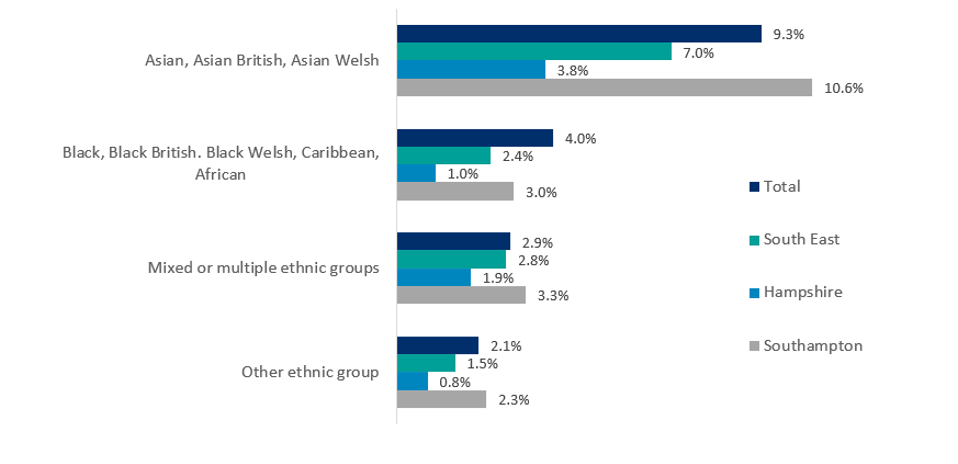
Compared against external data
The latest census data taken in 2021 shows that the South East and in particular Hampshire, have a less represented population of Asian, Black, and Mixed when compared to the UK as a whole. However, Southampton is much more in line with the UK average. This helps us compare CUK’s Ethnic representation against our surrounding talent pool.
- Asian ethnicity at CUK (3.5%) is similar to Hampshire’s figure of 3.8% but significantly lower than the UK figure of 9.3% and Southampton’s figure of 10.6%.
- Black ethnicity follows the same trend at 0.7% for CUK. Similar to Hampshire’s figure of 1.0% but significantly lower than the UK figure of 4.0% and Southampton’s figure of 3.0%.
- Mixed ethnicity at CUK is closer to the national and local representation but still slightly underrepresented. With CUK at 1.9%, Hampshire has a figure of 1.9%, UK has a figure of 2.9% and Southampton with a figure of 3.3%.
In August 2022, we worked with an independent agency to complete a benchmarking exercise for us to compare against our local corporate market (1.5hr commute time from Southampton).
- This data shows a talent supply in the local area of between 2% and 4% Asian ethnicity against CUK’s 3.5%
- This data shows a talent supply in the local area of between 1% and 2% Black ethnicity against CUK’s 0.7%
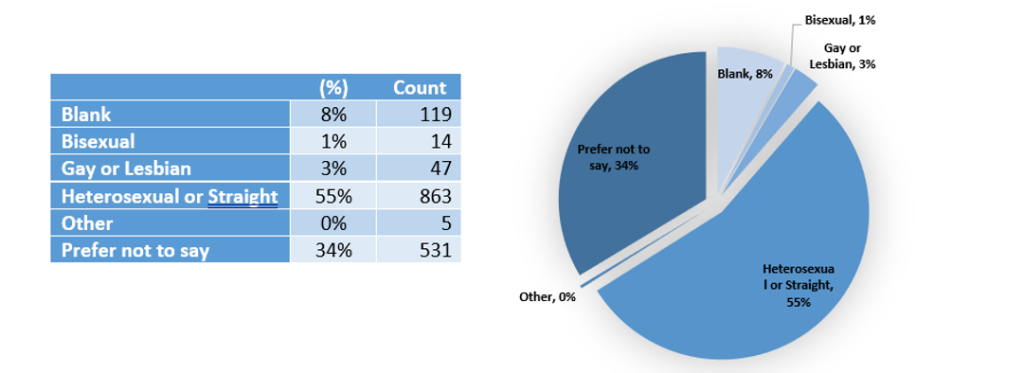
Sexual Orientation
Carnival UK current position: April 2023
Year on year
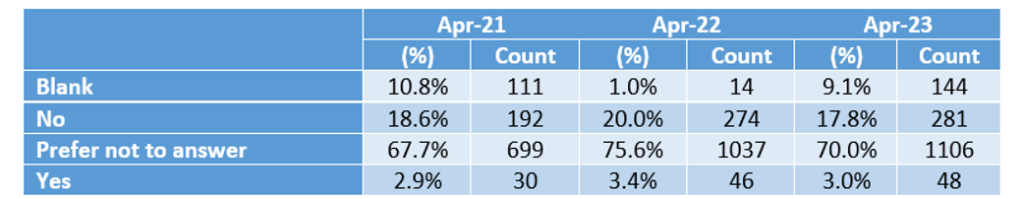
Since April 2021 there has been no significant changes to the breakdown of sexual orientation at Carnival UK.
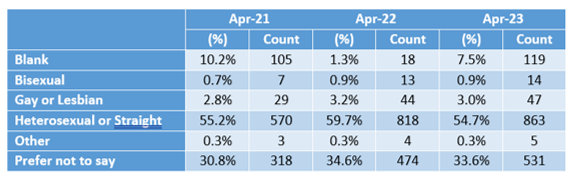
The largest anomaly with Carnival UK’s sexual orientation data is within our ‘prefer not to say’ population which represents 33.6% of our colleagues. This is against 7.06% in the South East and 8.3% in Southampton’s census data and so could indicate an environment in which our colleagues do not feel comfortable in sharing this information.
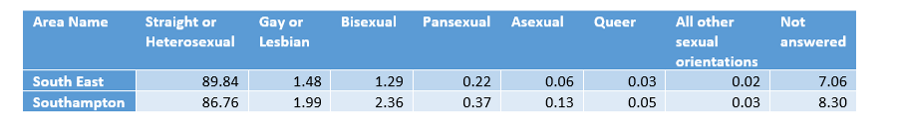
Compared against census data
The latest census data taken in 2021 shows that compared to both the South East and Southampton, Carnival UK’s LGBTQ+ populations are fairly represented. It is worth reiterating that Carnival UK have a large proportion of colleagues who have answered ‘prefer not to say’ which could significantly impact some of these figures if their answers change.
- Our Bisexual population are slightly underrepresented with only 0.9% compared to the South East average of 1.29% and Southampton’s average of 2.36%.
- Our Gay or Lesbian population is above the census average at 3.0% compared to the South East average of 1.48% and Southampton’s average of 1.99%.
- Our Heterosexual or straight population is at 54.7% compared to the South East average of 89.84% and Southampton’s average of 86.76%.
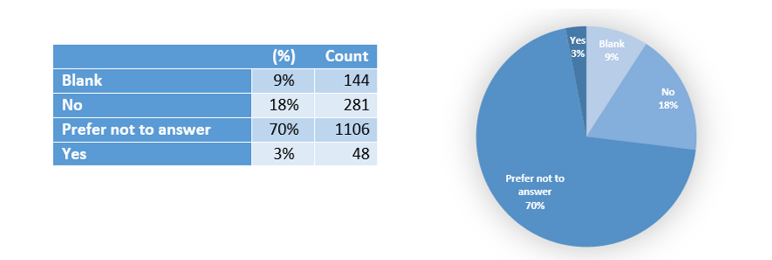
Disability
Carnival UK current position: April 2023
Year on year
Since April 2021 there has been no significant changes to the representation of disabilities within Carnival UK.
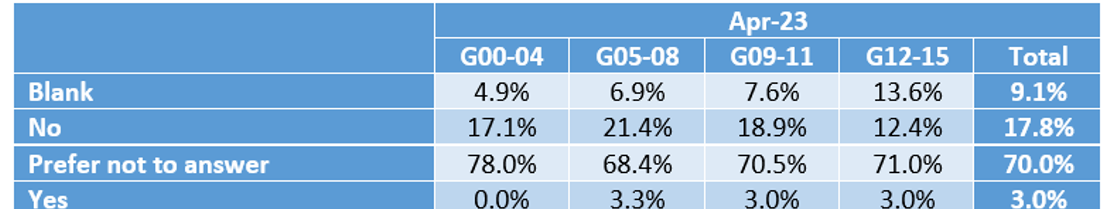
The largest anomaly is again in the ‘prefer not to say’ population as this accounts for 70% of total colleagues. This may indicate a culture in which people do not feel comfortable to share this kind of information and makes insights into disabilities difficult as we do not have an accurate picture.
Differences across grades
When looked at across CUK’s grade groups, CUK grades 15-05 are fairly comparable to Carnival UK’s overall split. However, grades 00-04 have no disability representation and a higher than average ‘prefer not to answer’ with 78% compared to the company average of 70%.
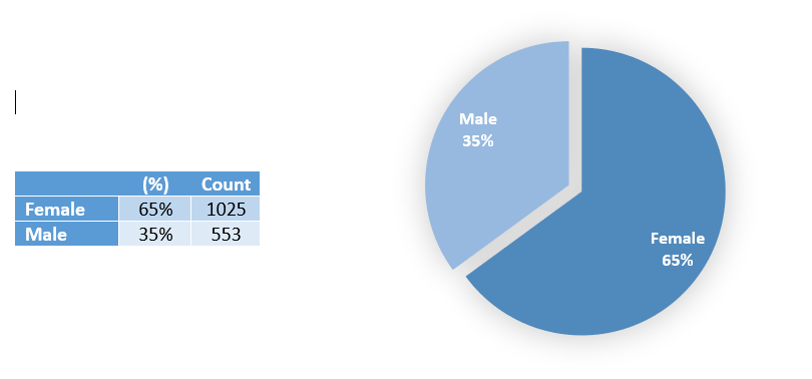
Gender
Carnival UK current position: April 2023
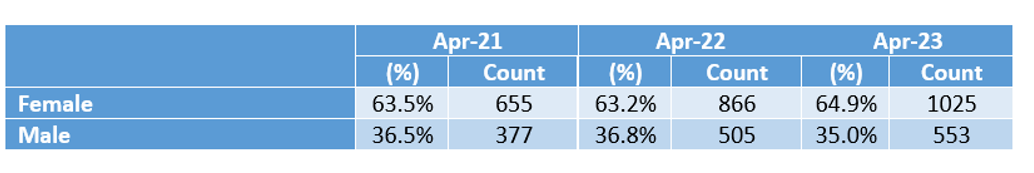
Year on year
Since April 2021 we have not seen a lot of movement in the gender split of Carnival UK population. We have seen a slight drift of 1.4% from 63.5% to 64.9% in the female population.

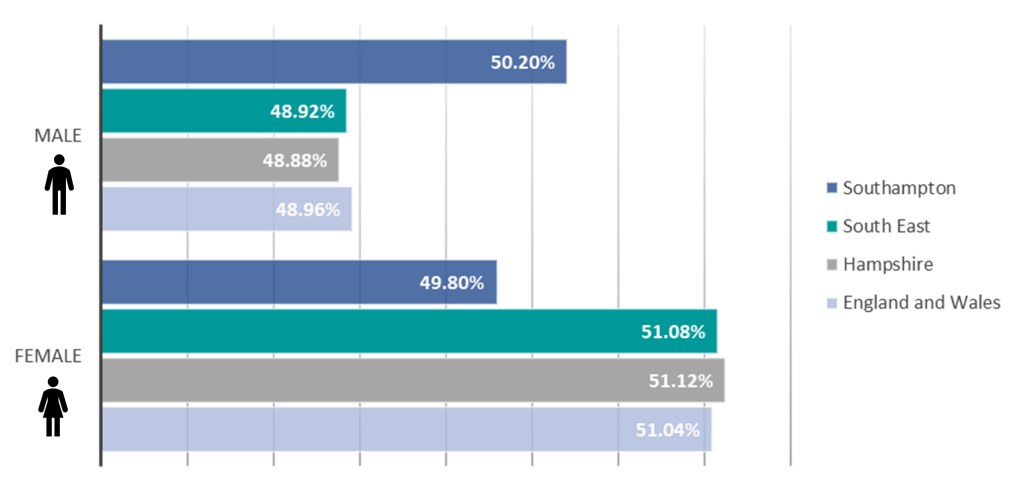
Compared against census data
The latest census data taken in 2021 shows that at a regional and national level, gender is split 51% female to 49% male. This is slightly more skewed towards males inside of Southampton with the breakdown being almost 50:50.
This shows that as a business, we are more skewed towards females with 64.9% of our population against the census data of 50%-51%.
Differences across grades
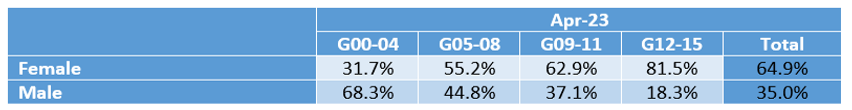
When looked at across CUK’s grade groups, this is when we can see the highest imbalance.
- Grades 12-15 are where we see the highest level of gender imbalance, which have a disproportionate number of females at 81.5% compared to CUK average of 64.9%.
- Grades 09-11 are also skewed to females (62.9%), closer to the CUK average of 64.9%.
- Grades 05-08 are the most equal gender split with colleagues being 44.8% male compared to the CUK average of 35.0%.
- Grades 00-04 are the only CUK levels that skews towards males, with colleagues in these grades being 68.3% male, almost double CUK average of 35.0%.
Gender Pay Gap Report
This gender imbalance and subsequent action plan has been picked up and mentioned in our latest gender pay gap report. In the latest report we did see a slight decrease in the mean pay gap which had reduced by 1%, now down to 35% from the previous year. The report had highlighted the gender representation across grades and lack of females in senior roles.
“To eradicate the gap, we need greater gender balance across the organisation, and will continue our focus on increasing the number of women in senior roles in general, addressing gender representation across the various teams and business areas.”
For information about what we’re doing to make Carnival UK a more diverse and inclusive workplace, please read our gender pay gap report. Although the primary reason for this report is to assess gender balance, you will also find information in here about action on other characteristics and initiatives that generally support all colleagues.
Employee Led Networks
If you’d like to get involved in supporting our effort to be a more diverse, equitable and inclusive organisation, you can get involved with our employee networks. These groups provide support, education and a place to feedback on how we could be doing better. We really benefit from everyone being included in the networks, whether you identify with having a characteristic that the group supports, or if you’re an ally who is there to learn more.